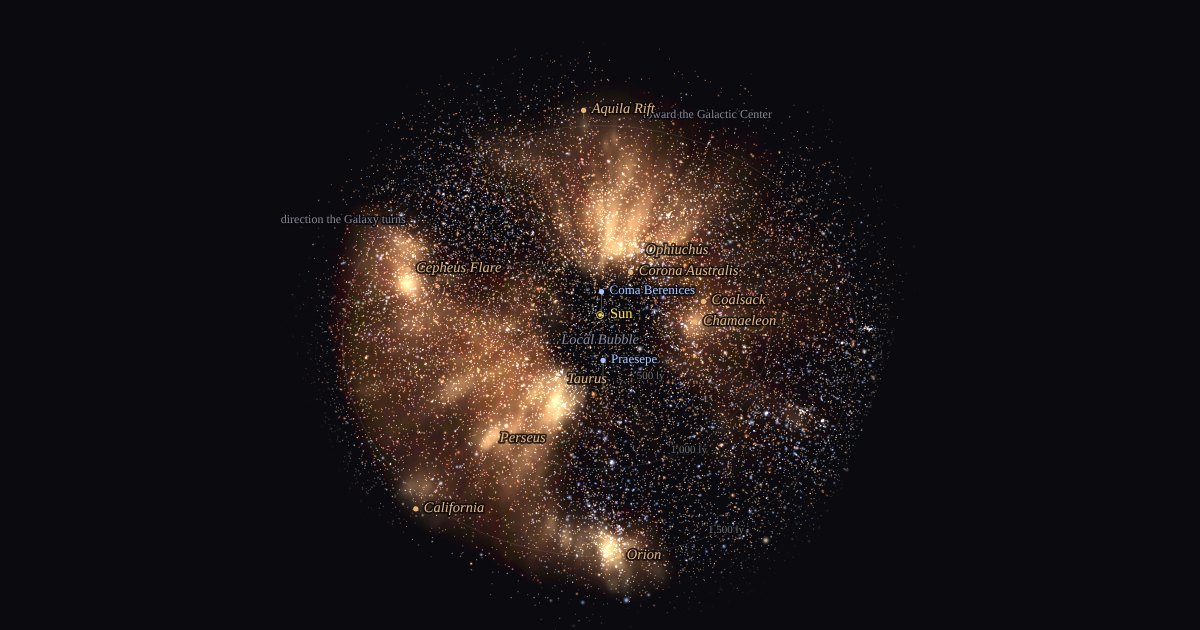
We live in a hole
Step back eighty times from the neighborhood and the Sun’s surroundings take a shape. The space around us is nearly empty of dust: a cavity about a thousand light-years across called the Local Bubble, blown out by a run of supernovae over the last fifteen million years or so. Nothing on this map outlines it. The darkness in the middle is simply what the measurements show.
The swept-up material piled into a shell, and nearly every nearby cloud where stars are forming now sits on that shell: Taurus, Ophiuchus, Lupus, Chamaeleon, Corona Australis. Farther out lie the great complexes of Perseus, Orion and Cepheus. Tilt the map and the clouds separate in height, some of them well above or below the plane the Sun moves in.
What the points are
Each point is a real star, placed at its measured distance: about twenty-four thousand of them, every catalogued star in this volume that gives off more than about fifty times the light of the Sun. Blue-white points are hot and young. They gather in loose associations, and the nearest, Scorpius–Centaurus, is the family whose dying members made the bubble. Stars like the Sun are too faint to appear here at all. This volume holds more than ten million of them.
The scale of the task
That number is the reason to draw this map. The neighborhood holds about a hundred systems. The disk of the Galaxy inside this one frame holds ten million or more, and the frame is about one-thirtieth of the Galaxy’s width. In the simulation on the Expansion page, machines that build copies of themselves spread out from the Sun and cross this whole map in roughly thirty thousand years. People who still need Earth-like worlds have, in the same time, barely left the gold ring.
How this map was made
The dust comes from the three-dimensional map of Wang and colleagues (2025), which measures how starlight reddens with distance along twelve million lines of sight, using observations from the Gaia space telescope and the LAMOST survey. We sampled it on a grid 3,260 light-years wide and 1,300 deep and checked the result against published cloud distances. Taurus, Perseus, Orion, Cepheus, Musca and the Aquila Rift land within five percent of their measured distances; Corona Australis and the Pipe Nebula are off by about fifteen percent.
Three cautions. The map is fitted one line of sight at a time, which smears clouds along the direction away from the Sun; we limit each cloud’s depth to about a hundred light-years and smooth sideways, but faint streaks pointing away from the center remain and are not real. Texture finer than about ten light-years is noise. And the far edge of the map is less certain than the middle: distances to the most remote supergiants can be wrong by a large fraction.
Stars are from the AT-HYG catalogue, built on the Gaia and Hipparcos space telescopes. Cloud positions follow Zucker and colleagues (2020); the Local Bubble’s origin follows Zucker and colleagues (2022).